

Trading Overbought and Oversold Market Conditions Properly

Trading Overbought and Oversold Market Conditions. Shutterstock Images
The class of indicators that can be used to trade overbought and oversold market conditions are the oscillators (momentum indicators). One hallmark of oscillators is that most of them have a vertical range, with a well-defined lower range and upper end of the range.
These lower and upper ends of the vertical range correspond to periods when the market is oversold or overbought respectively.
They also have a signal line, which is what indicates when prices are overbought or oversold, whenever it moves into the extremes of the vertical range.
The overbought/oversold market signals are one of the ways that the oscillators can be used to trade the financial markets. Unfortunately, many retail beginner traders do not understand how to trade the overbought/oversold signals properly.
The following cryptocurrency trading guide will help everyone to trade them as a pro.
How to Trade Overbought and Oversold Market Conditions
Overbought and oversold market conditions represent price extremes. These levels are seen when the oscillator’s signal line is at the upper extreme of its indicator window, or at the lower extreme of the indicator window.
For instance, the Relative Strength Index (RSI) and Stochastics oscillator see their overbought and oversold values presenting themselves at above 70 and below 30 respectively.
Oscillators usually have a signal line, and it is the position of this signal line at the price extremes which are used in gauging when markets are oversold or overbought.
So how should be these overbought/oversold signals traded? This can be done using what is known as the “failure swing” method. Many cryptocurrency beginner traders make a very common mistake when trading overbought/oversold market conditions.
They think that once the signal line of the indicator has entered into the price extreme areas in the indicator window, then it is time to sell (overbought) or buy (oversold). This is a wrong approach and will lead to nothing but disappointments and losses.
But with the failure swing method, the trader is able to trade with a more reliable signal and one that has a lot of technical basis.
The Failure Swing
Some authorities have ascribed the description of the failure swing to Welles Wilder, who demonstrated the strategy using the Relative Strength Index (RSI) indicator.
The failure swing describes a situation where the signal line of the oscillator pushes in and out of the overbought or oversold zones to form a top or a bottom respectively, followed a repeated attempt to re-enter these zones without being able to reach the previous overbought height or the previous oversold depth. This is demonstrated in the chart below.
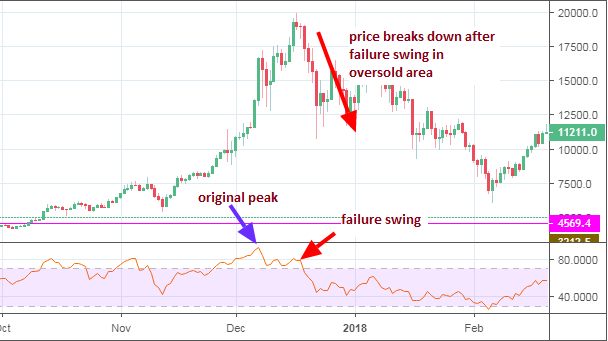
Failure swing of RSI Signal Line in Overbought Area. Tradingview Images
In this snapshot, we can see the RSI indicator line entering into the overbought region and moving lower to form the peak within the overbought extremity. Shortly after, the signal line made another attempt to push up to the same level of the 1st peak, but was unable to do so.
This is the failure swing. This was followed shortly by a breakdown of price action to follow the signal line of the RSI in a downward move.
In trading this setup, you have to wait until the RSI signal line has formed successively falling peaks, then take a short trade using a valid technical entry such as a bearish candlestick formation.
You can exit the trade using a valid means of technical exit, such as price arriving at a site where price had previously formed support.

Failure swing of RSI Signal Line in Oversold Area. Tradingview Images
The 2 successively higher troughs formed by the RSI signal line can be seen. We see the 1st trough forming well in oversold territory, while the 2nd trough failed to go as low as the 1st, forming the “failure swing”.
In trading this setup, you have to wait until the RSI signal line has formed successively rising troughs, then make a long trade entry using a valid technical reason such as a bullish candlestick formation. You can exit the trade using a valid means of technical exit, such as price arriving at a site where price had previously formed a resistance.
The Divergence
The failure swing can also be used to trade the divergence signals formed by oscillators. What better way exists to trade the divergence setup than when we see lower highs in an overbought area when price has formed higher highs, or higher lows in an oversold area when price has formed lower lows?
The failure swing is essentially a higher low (oversold) or a lower high (overbought). Occurring at price extreme points increase the chances of the divergence setup being very successful indeed.
Read Next: What are the Best Alternatives to coinmarketcap.com?
Conclusion
In all trading instances of the failure swing strategy, the importance of volume cannot be overemphasized. It must be stated that you can watch the volume progression to see if it tells a story.
For instance, if you notice that buying volumes are waning when the failure swing is occurring in the overbought area, this reinforces the signal to sell. Waning buying volumes is seen as green volume bars that are getting progressively shorter. Another progression that favours selling is if sell volume bars appear and get very long quite quickly.
Similarly, diminishing selling volumes at a time when the indicator’s signal line has formed the failure swing in the oversold area is a reinforcement of a signal to buy.
Of course, if the opposing volume bars appear and turn out to have a good height, this is a sign that the players on the opposite side of the coin have entered the market, and this should also prompt the trader to take buying action.
References
Disclaimer
The writer’s views are expressed as a personal opinion and are for information purposes only. It is not intended to be investment advice. Seek a duly licensed professional for investment advice.More Posts

The Crypto Code: Can You Trust for Cryptocurrency Trading?
The cryptocurrency market is one of the most promising yet challenging trends in the investing world. In fact, the chall...

Reasons Cryptocurrencies Are Becoming Increasing Popular
To this day, many experts continue to warn traders and investors against crypto trading for several reasons. But despite...

How to Avoid Losing In Cryptocurrency Trading Business
The rise of cryptocurrency since 2009 has come with many positive and negative opportunities. The value of many cryptocu...

Challenges Facing Crypto Exchanges & How to Solve Them
The major challenges cryptocurrency exchanges face. shutterstock.com Following the advent of Bitcoin in 2009, the probl...


